Menu
AR RF/Microwave Instrumentation once again sets the standard with the introduction of its fast RF power measuring PSP series wideband USB pulse power sensors. Built with Real-Time Power Processing™ technology, this new product line offers the high speed and accuracy that customers demand. AR’s USB pulse power sensors are ideal for EMC testing, manufacturing testing/troubleshooting, amplifier design/development, and research. These devices can be used in commercial and military applications such as telecommunications (LTE-TDD/FDD), avionics, RADAR, and medical systems. They are the instrument of choice for fast, accurate, and highly reliable RF and microwave power measurements.
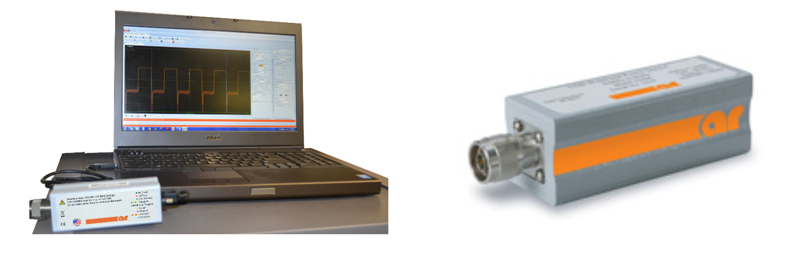
This application note will discuss some of the key features and benefits of AR’s new line of PSP Series Wideband USB pulse power sensors, as shown below.
The USB Pulse Power Sensor functions as an ultra-fast, calibrated power measurement tool which acquires and computes the instantaneous, average, and peak RF power of a wideband modulated RF signal. An internal A/D converter operates at up to 100 MSamples/second, and a digital signal processor carries out the work required to form the digital samples into a correctly scaled and calibrated trace on display. Figure 1 shows a block diagram of the peak power sensor.

The first and most critical component of a peak power sensor is the detector, which removes the RF carrier signal and outputs the modulating signal’s amplitude. The video detector’s bandwidth dictates the sensor’s ability to track the RF signal’s power envelope. The picture on the left in Figure 2 below shows how a detector with insufficient bandwidth cannot faithfully track the signal’s envelope, therefore affecting the accuracy of the power measurement. In contrast, the detector on the right has sufficient video bandwidth to track the envelope accurately.
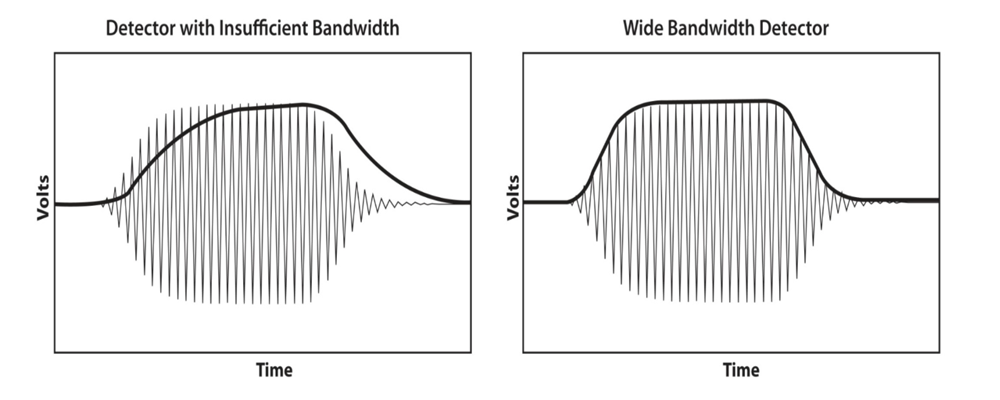
The detector can track very fast amplitude changes due to modulation by optimizing the sensor’s response time. The sensor’s video bandwidth must be at least as wide as the signal’s modulation bandwidth to track it accurately. The PSP001 provides an industry-leading video bandwidth of 195 MHz for spread-spectrum signals and measures rise times as fast as 3ns. It has a sample rate of 100 MHz, enabling the analysis of both very short bursts and very broadband signals and power versus time waveforms in very high resolution.
Real-Time Power Processing (RTPP) is a new signal processing technology that is a key factor in ensuring accuracy. This advanced technique enables the sensors to constantly collect samples without any gaps in their acquisition, ensuring that no data is lost. The conventional method involves collecting samples until the sensor’s buffer is full, at which point acquisition stops until the collected samples are processed. RTPP collects and processes samples so quickly that the buffer is never filled. To create a trace on the screen, conventional meters and USB sensors carry out the required steps in sequence, which means that processing can take as long as tens or hundreds of milliseconds. Real-Time Power Processing performs many of these steps in parallel. It is unnecessary to halt acquisition at full acquisition rate following a trigger event to wait for the processing stages to catch up.
AR’s PSP Series Wideband USB pulse power sensors and the key features are listed in the following table:
| Specifications | PSP001 | PSP002 | PSP003 | PSP004 | PSP005 |
|---|---|---|---|---|---|
| RF Frequency Range | 50 MHz to 6 GHz | 50 MHz to 18 GHz | 50 MHz to 40 GHz | 50 MHz to 18 GHz | 50 MHz to 40 GHz |
| Average Dynamic Range | -60 to+20 dBm | -34 to +20 dBm | -34 to +20 dBm | -50 to +20 dBm | -50 to +20 dBm |
| Pulse Dynamic Range | -50 to +20 dBm | -24 to +20 dBm | -24 to +20 dBm | -40 to +20 dBm | -40 to +20 dBm |
| Internal Trigger Range | -38 to +20 dBm | -10 to +20 dBm | -10 to +20 dBm | -27 to +20 dBm | -27 to +20 dBm |
| Risetime (fast/slow) | 3 ns/<10 μs | 5 ns/<10 μs | 5 ns/<10 μs | <100 ns/<10 μs | <100 ns/<10 μs |
| Video Bandwidth | 195 MHz/350 kHz | 70 MHz/350 kHz | 70 MHz/350 kHz | 6 MHz/350 kHz | 6 MHz/350 kHz |
| Single-shot Band-width | 35 MHz | 35 MHz | 35 MHz | 6 MHz | 6 MHz |
| RF Input | Type N, 50 ohm | Type N, 50 ohm | 2.92 mm, 50 ohm | Type N, 50 ohm | 2.92 mm, 50 ohm |
| VSWR | 1.25 (0.05-6 GHz) | 1.15 (.05-2.0 GHz) 1.28 (2.0-16 GHz) 1.34 (16-18 GHz) | 1.25 (.05-4.0 GHz) 1.65 (4-38 GHz) 2.00 (38-40 GHz) | 1.15 (.5-2.0 GHz) 1.20 (2.0-6.0 GHz) 1.28 (6.0-16 GHz) 1.34 (16-18 GHz) | 1.15 (.05-2.0 GHz) 1.65 (4.0-38 GHz) 2.00 (38-40 GHz) |
| Key Features: | |||||
|
| ||||
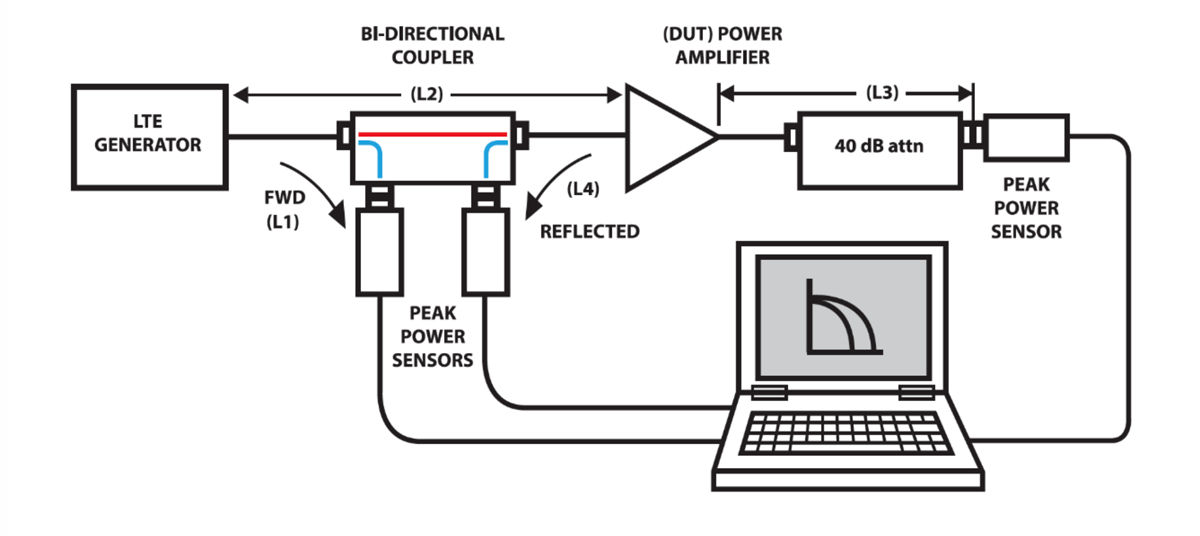
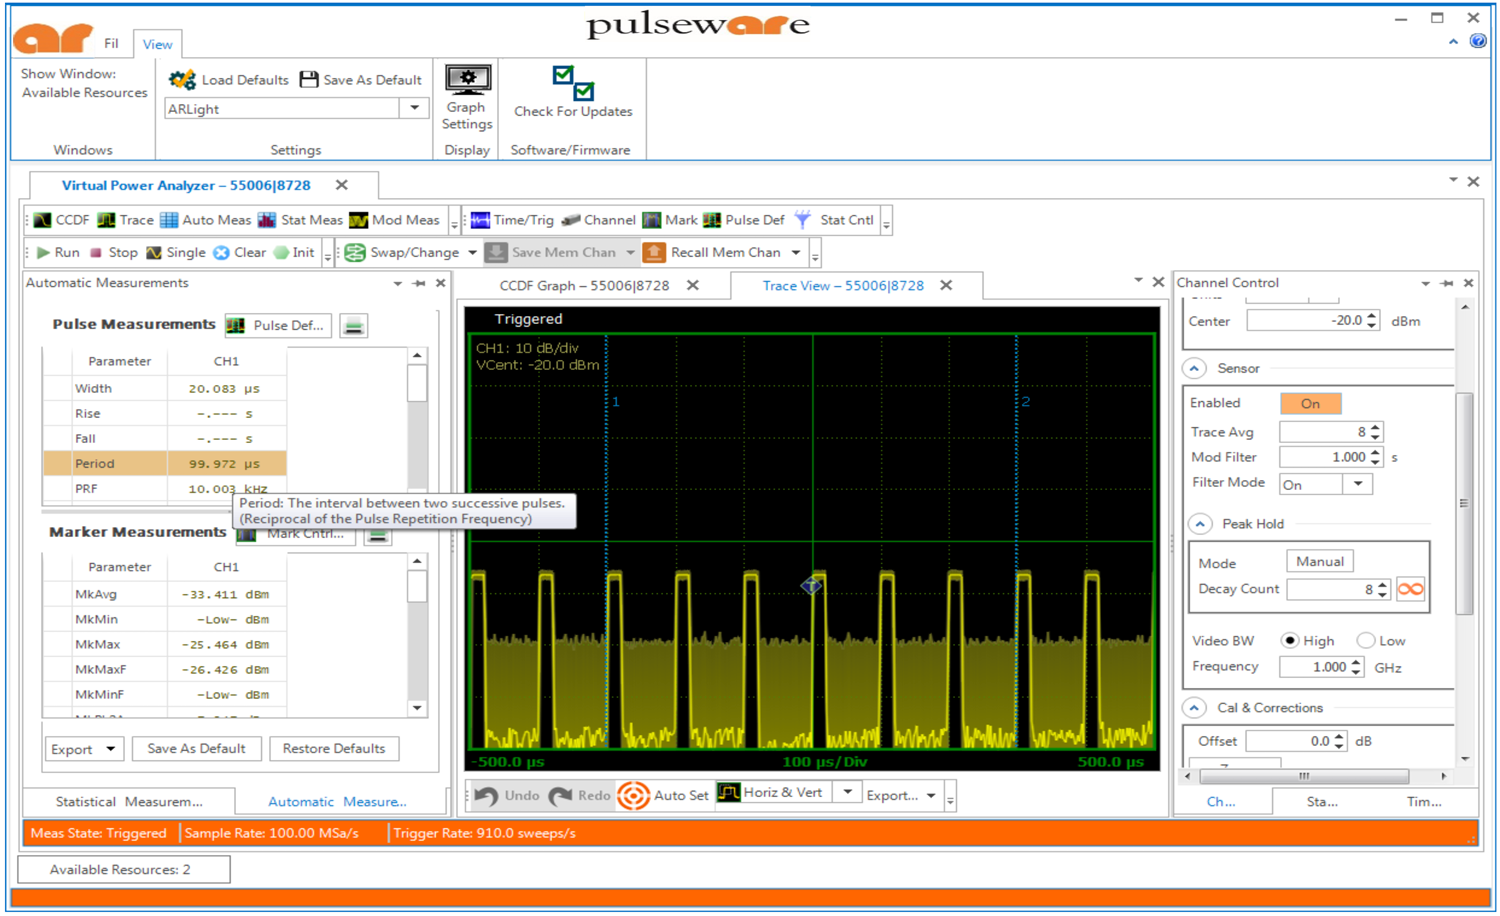
Figure 3 (below) shows an example of AR’s PSP series demo set-up, where we make readings similar to a scalar analyzer to measure gain of an RF power amplifier. The PSP Series pulse power sensors are supported by both AR’s emcware® software and PulsewARe. PulsewARe is a Windows-based software package that provides control and readout of the sensors as shown in Figure 4. It provides both time and statistical domain views of power waveforms with variable peak hold and persistence views. Power measurements are supported using automated pulse and statistical measurements, power level and timing markers. The GUI application is easily configured with dockable or floating windows and measurement tables that can be edited to show only the measurements of interest.
With statistical analysis capability the PSP series can display the statistical distribution of the signal power level relative to its average power in a format called complementary cumulative distribution function (CCDF), as well as the ratio of peak values to the effective value called crest factor (CF). CCDF can give significant insight into the behavior of the power amplifier as it is driven harder into saturation by measuring changes in peak to average ratio (PAR) and crest factor (CF) of the input and output signals simultaneously, while providing a graphical view of the compression of the amplifier in real-time. The Statistical Analysis tool of the PSP Series creates a CCDF graph of the input & output signals and tabular format displaying of cursor readings, average, peak and peak to average power as shown in Figure 5 and Figure 6 respectively.
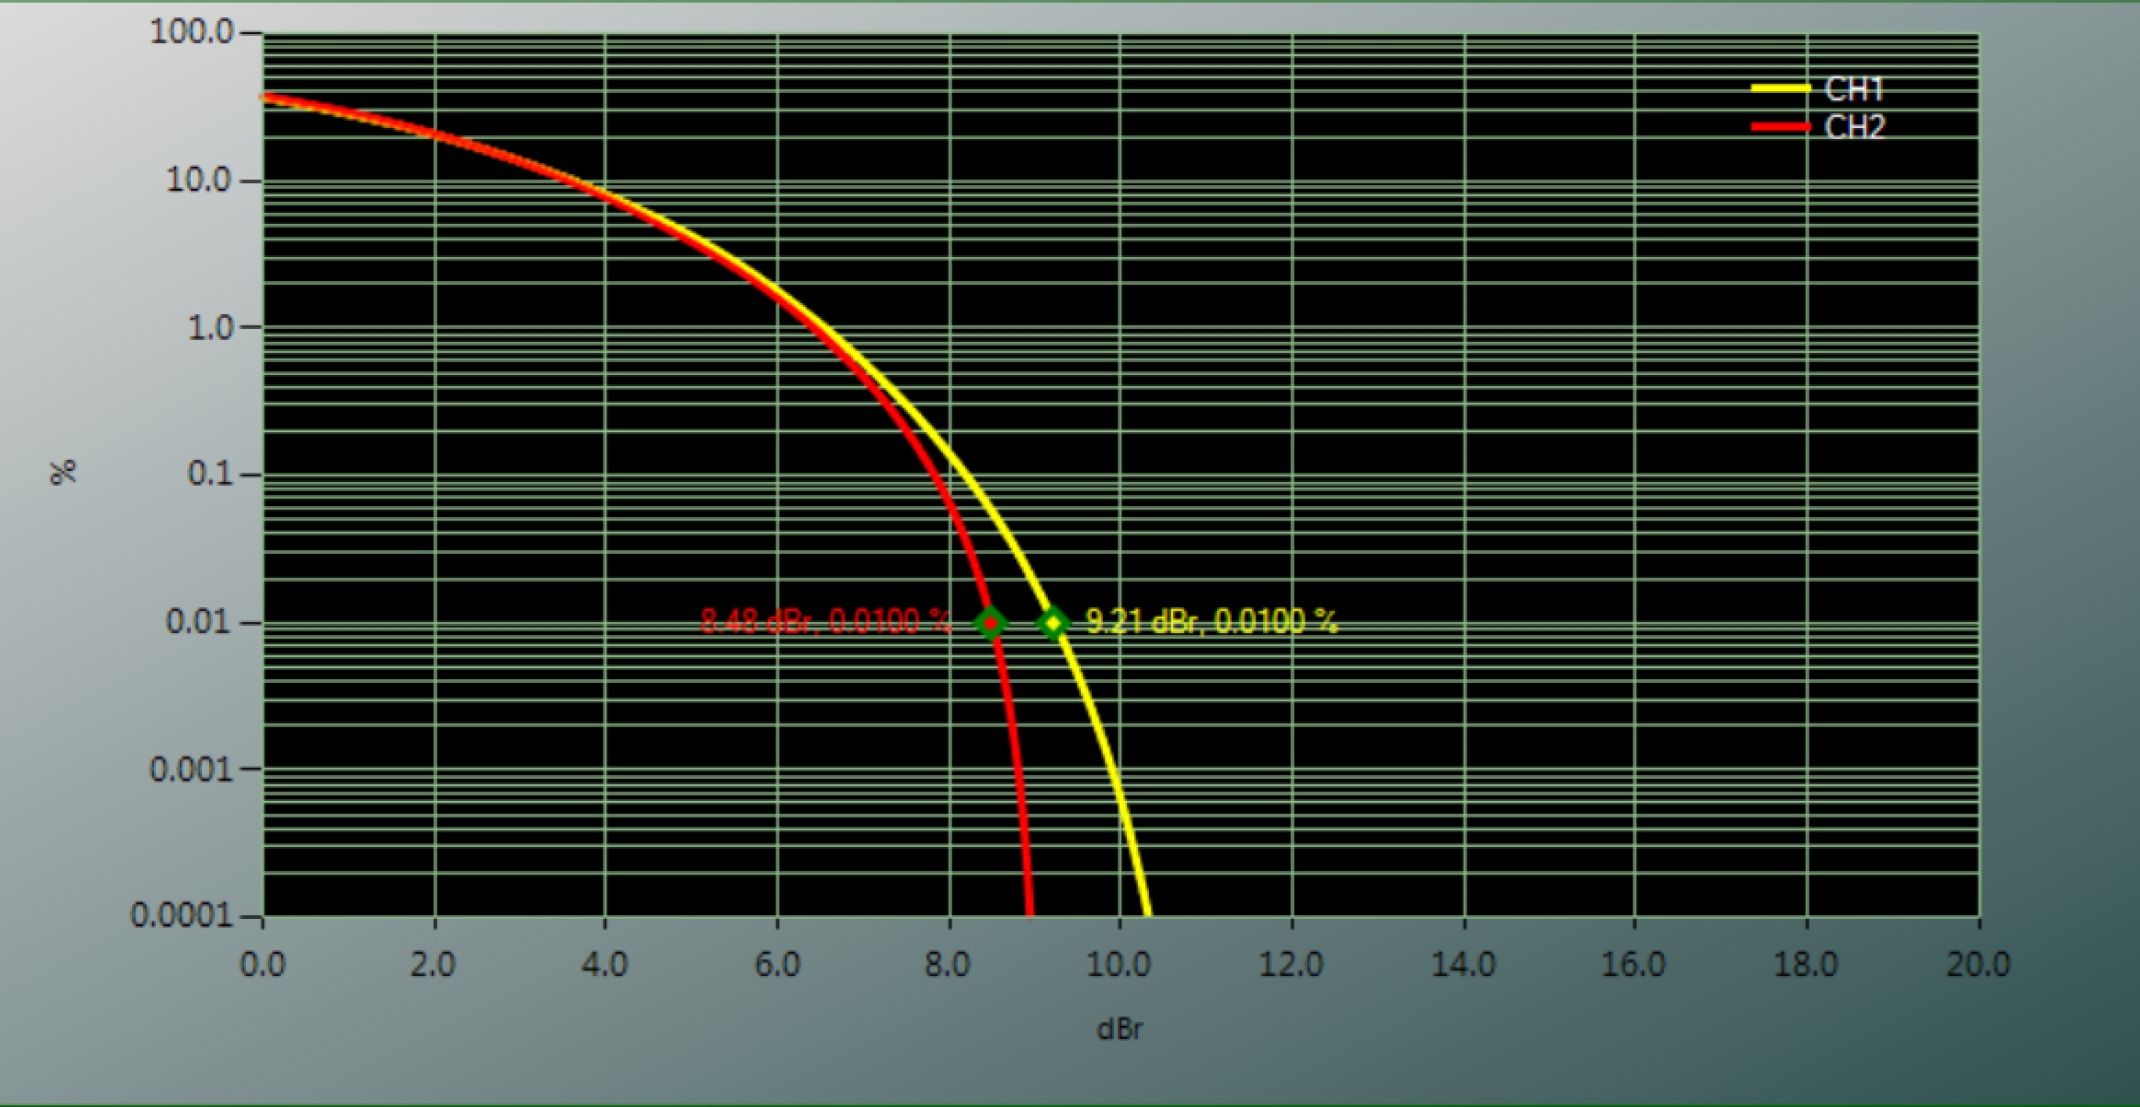
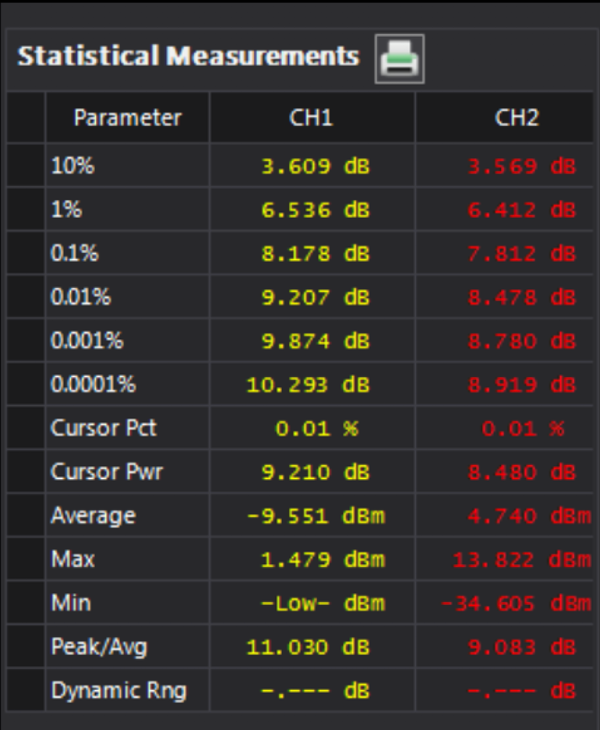
The crest factor can be computed at any percent probability point; depending on the system requirements and specifications, the user can place the cursor at the desired probability point where the crest factor measurement is to be made. Similarly, to measure P1 dB of an amplifier, the cursors can be moved along the CCDF curve to the probability point where the difference between input and output crest factor is 1 dB, allowing the designer to determine the P1 dB compression characteristics of the amplifier.
AR’s PSP series wideband USB pulse power sensors are the instrument of choice for FCC EMC compliance testing of wireless electrical and electronic products called Intentional Radiators that may produce radio frequency pollution (not infrared or ultrasonic energy). In general, radiated emissions are usually associated with unintentional radiators, but intentional radiators can also have unwanted emissions at frequencies outside their intended transmission frequency band.
AR’s PSP series wideband USB pulse power sensors and new Solid-state pulsed amplifiers are products of choice to perform EMC and RF immunity testing for numerous market applications. The PSP series instruments can precisely measure the pulse shape, characteristics and peak amplitude being produced by the amplifier.
The USB pulse power sensors are ideal for radiated immunity, telecommunications and intentional radiator EMC testing, as well as applications in manufacturing, design and research. The design of these products allows for fast, accurate and reliable RF power measurements of a wide range of pulsed, modulated and CW signals. Additionally, the PSP series are perfect for precisely measuring the pulse characteristics of AR’s SP-series solid-state pulse amplifiers. If you would like to learn more about our new PSP Series Wideband USB pulse power sensors and PulsewARe software, feel free to contact one of our application engineers at (800) 988-8181. Or visit our website at http://www.arworld.us.
160 Schoolhouse Rd.
Souderton PA 18964-9990 USA
215.723.8181
[email protected]
[email protected]
Contact Us
For an applications engineer call:
800.933.8181
For Customer Service, call:
215.723.0275
For Faxing Orders:
866.859.0582 (Orders Only, Please)
Privacy Policy
Terms of Use
Copyright ©2023 AR Inc.